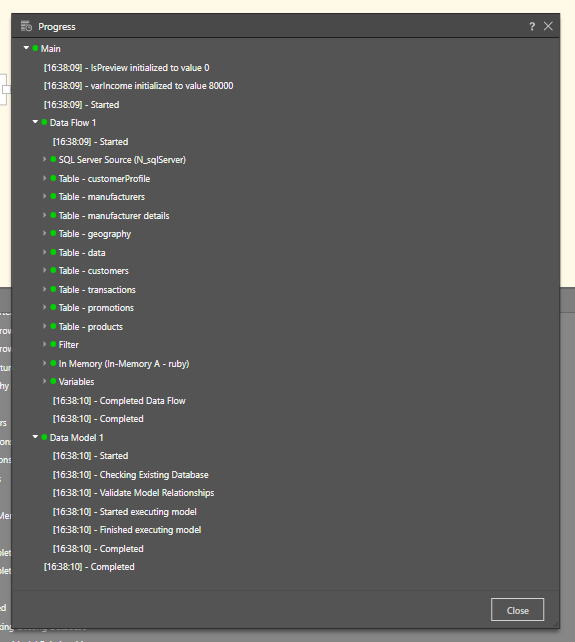
The Progress Panel shows the execution status of a model as it is processed. It automatically appears at the bottom of the page when the model is processed and can also be accessed from the Job Spooler.
Progress Nodes
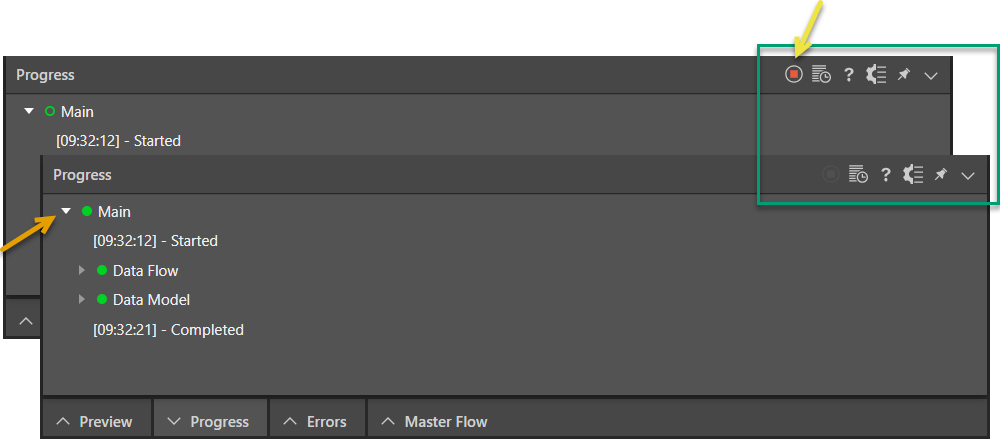
You can expand the nodes to review detailed logs and interact with the views using the controls:
Status Key
Each node in the model flow is listed with a colored circle indicating its status:
- Green (empty): In progress.
- Green (filled): Completed successfully.
- Orange: Completed with warnings.
- Red: Failed.
Execution Tree
Main Node
The Main node (orange arrow above) appears at the top of the tree:
- Labeled Main (the parent node).
- When the model is processed successfully, this node can be expanded to show:
- Time of initialization for variables in the Data Flow.
- Processing start time.
- Time of completion (where processing is complete).
Data Flow Node
The Data Flow node appears inside the Main node:
- Shows when the data flow started.
- Lists all child nodes within the data flow.
- For each node, you can view:
- Start time.
- Number of rows processed.
Data Model Node
The Data Model node also appears inside the Main node:
- Indicates the start and end times for model processing.
- Shows execution duration for:
- Validation of model relationships.
- Overall model execution.
Progress Panel Controls
The following header options (green highlight above) are available at the top-right of the panel:
- Cancel: (Yellow arrow.) Stop the execution. This option is only available while processing is underway. Once processing has completed, it becomes disabled.
- Progress View: Switch between the execution views: the Progress Tree view (default) and the Progress Table view. For details of the Progress Table, see below.
- Move to Logs: Jump to the System Logs for deeper diagnostics.
- Pin: Keep the panel fixed in the dock so it remains visible while you work.
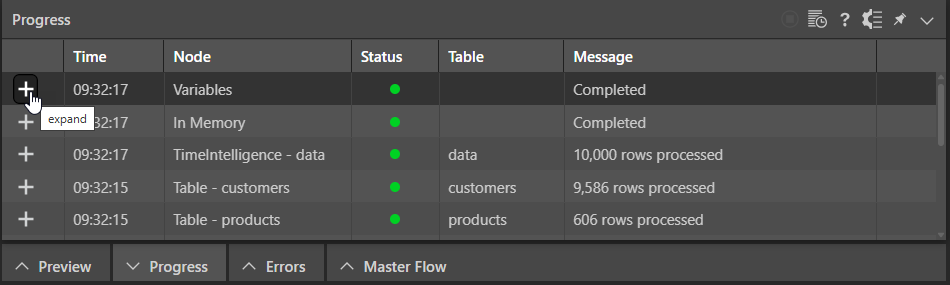
Progress Table
Related information
Accessing the Progress Log from the Job Spooler
Click Data Flow Progress (blue arrow below) in the job spooler:
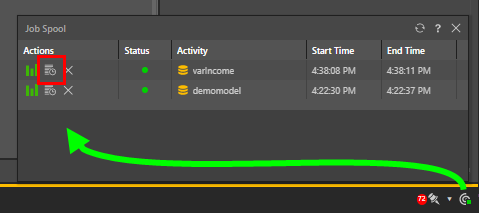
This opens the Progress dialog: